As I wait for some details on a few of the branches of the family tree I thought it would be fun to see where our families were over the course of time. I took the Federal Census data and mapped locations over time. The most recent Federal Census that is available to the public is the 1940 census, so I started with that one. I then went back in time to the 1850 census and stopped there for a couple of reasons. One being that for most branches of the tree some of my data isn’t as complete at that point, and the other is that prior the 1850 the census only lists the head of household and not the family members, so accuracy is harder for some of the branches that I’m still working on. This is specific to folks in the United States only and there are some branches that are still being researched that aren’t included at this point. Regardless it was fun to see the migration patterns. Each of these maps shows my family tree branches in a green color, Cory’s family branches in a brownish color and any counties where they are both represented in a blueish color. I’m also including a legend in a PDF file that shows which families are in which county for reference. Hopefully I’ll have an opportunity to put an animation to this at some point.
Clicking on any one of the images will open it larger, and the text will be at the bottom of the image so you know which year you are looking at. There are then arrows that allow you to switch between images.
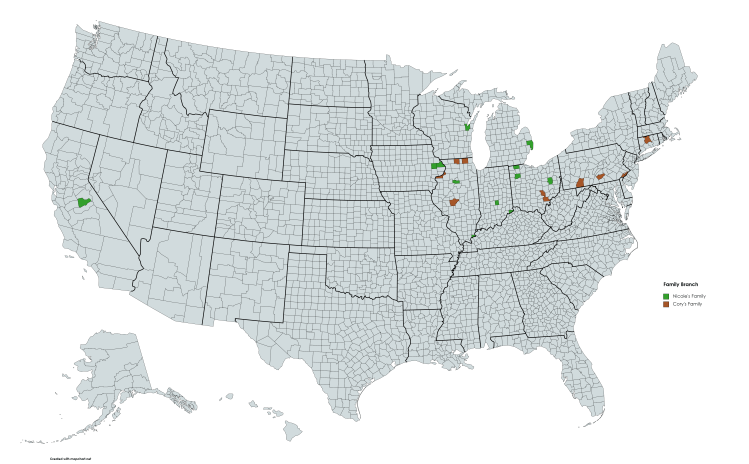
1850 Census – Family Locations 
1860 Census – Family Locations 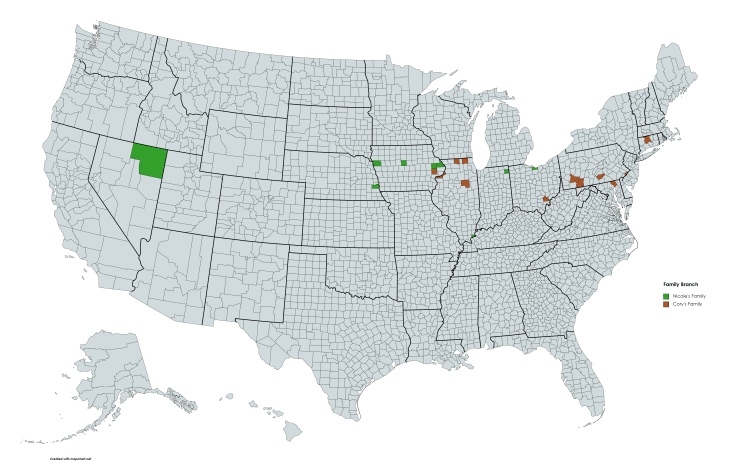
1870 Census – Family Locations 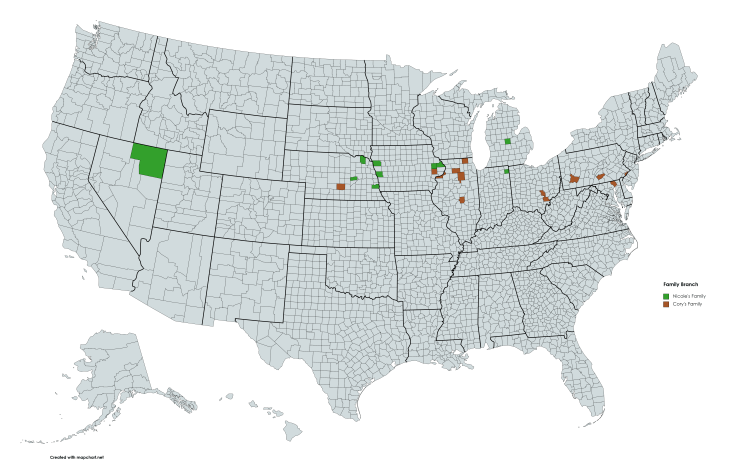
1880 Census – Family Locations 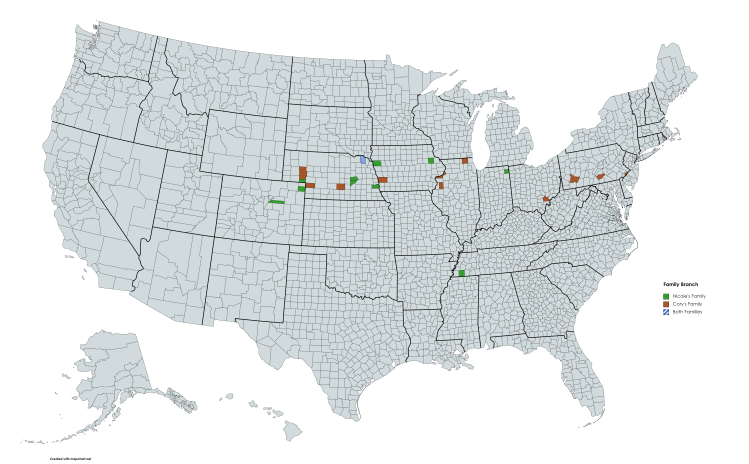
1900 Census – Family Locations 
1910 Census – Family Locations 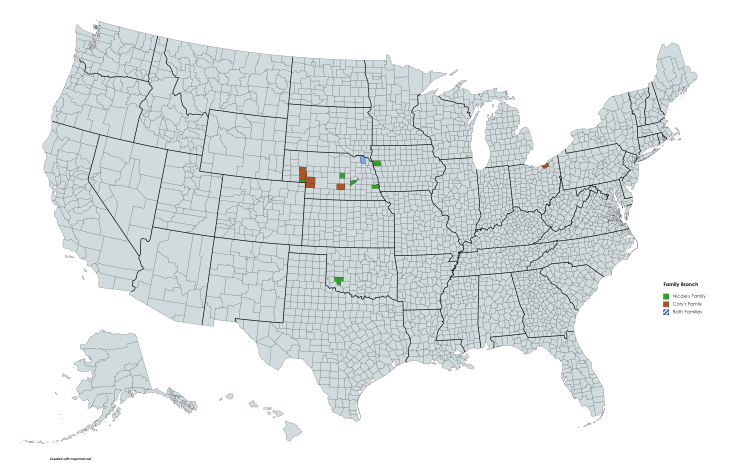
1920 Census – Family Locations 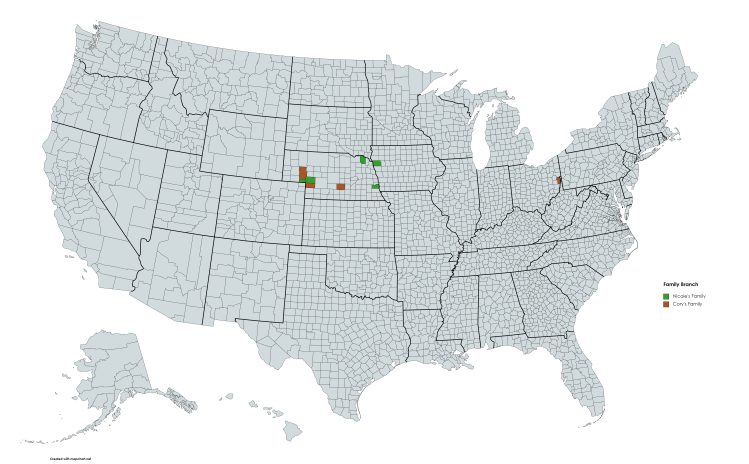
1930 Census – Family Locations 
1940 Census – Family Locations
